Celmis
Self-hosted — from the alert your monitoring already sent, through to a pull request someone can review
celmis-labs.github.io · Documentation · Quick start · Results
An alert arrives from a service you run. Celmis already knows which repository that service is and who owns it, so the fix starts there: an embedded Claude Code session — on your subscription, inside your installation — edits the code, and the runner commits, pushes a branch and opens a pull request. On one measured finding that took 220 seconds, from whatever device the alert reached first.
Celmis does not watch your services. Grafana, or whatever you already run, does that and does it well. This is the part that comes after the alert: the walk from a firing rule to a diff someone can review.
To be exact, because the line is easy to blur. The application ingests no logs of its own — it starts from the alert. But the repository ships an optional observability overlay, and that does collect them:
docker compose -f docker-compose.yml -f docker-compose.observability.yml up -d
That brings up Prometheus, Loki, Promtail and Grafana.
docker-compose.observability.yml is deliberately
platform-wide rather than Celmis-only: Promtail tails the Docker daemon's container
logs and labels each stream by container name, so every service on that host — all
thirty of them, if you run thirty — shows up in Grafana's Loki explorer, filterable by
container. Prometheus scrapes api:8000/metrics for Celmis's own counters alongside.
Every port binds to 127.0.0.1 and is reached over an SSH tunnel:
ssh -L 3100:localhost:3100 -L 9090:localhost:9090 you@your-server
That is not caution for its own sake. Loki has no authentication, so
POST /loki/api/v1/push accepts writes from anyone who can reach it, and a log store
strangers can write to is not a log store. GRAFANA_ADMIN_PASSWORD is required — the
stack will not start without one.
That loop is the product. It closes because everything sits on one index: a symbol graph Celmis builds from your repositories once. The same index answers questions that cross repository boundaries, reviews pull requests, audits dependencies into a CycloneDX SBOM and a verifiable evidence pack, generates documentation, and serves fifty-one tools over MCP — surfaces worth having, and none of them the point on their own.
It runs on one machine under docker compose, with the model provider of your
choice behind it, and nothing leaves your network except the calls you configure.
In the oldest telling, Kelmis was the smelter — one of the three Idaean Dactyls, alongside Damnameneus the hammer and Acmon the anvil, to whom the working of iron was credited. The index does the reducing here; the surfaces are what work the result.
#What that buys you that a diff-only tool cannot
Ask a question that spans two repositories, and the answer quotes both:
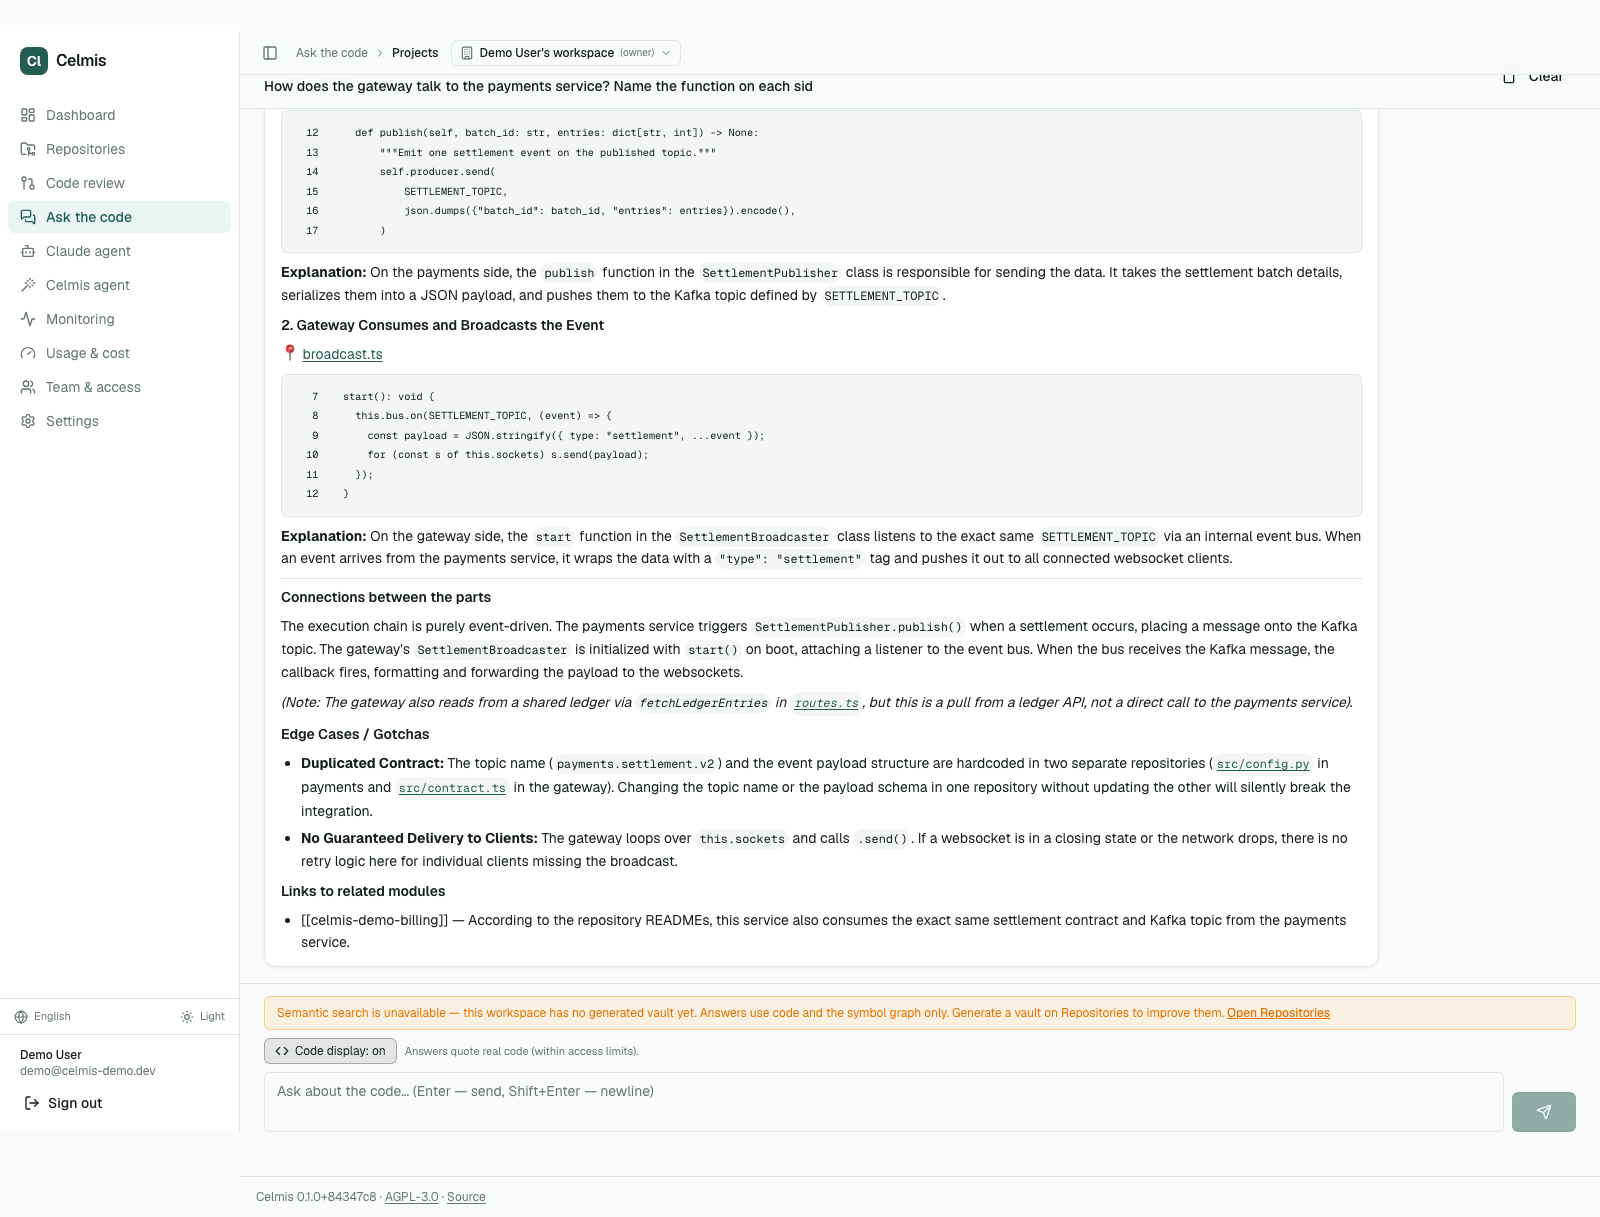
That is not a search result. The gateway and the payments service are separate repositories with no shared code, and the answer traces the call chain between them — then notices, unprompted, that the Kafka topic name is hardcoded in both and that changing one silently breaks the other.
A reviewer that reads only the diff structurally cannot say that. It never had the other repository open.
#Nine things people do with it
| You are a PM, a delivery lead or the client and want to know what state a group of projects is in, or how something actually works | Ask it. From any device, anywhere, without booking time from an engineer and without a meeting whose only output is a paragraph → Ask the code |
| A new engineer has a question a senior would have to answer | Every one of those pulls someone experienced out of flow, at the moment they are already covering. The codebase answers instead, with file:line citations → Ask the code |
| Two teams share an integration and neither can read the other's repository | Load it, grant the right to ask, and deny the paths that must stay private. They get answers; the credentials are refused at the source → Who can see what |
| A customer or an auditor asks for your SBOM | One button, CycloneDX, plus an evidence pack whose manifest they recompute themselves — against a hash you publish where the pack is not → Dependencies, SBOM and the evidence pack |
| A vulnerability lands in a dependency | Fix from here hands an embedded session the repository, the package and the finding. It edits, the runner pushes a branch and opens a PR → Fix from here |
| A pull request needs reviewing | Agents read the diff — and, where the graph is built, who else calls what is being changed, including from another repository → Pull-request review |
| Forty services need the same thing done to them | Write the sentence. Celmis shows which repositories it resolves to and waits for a second press, rather than finding them among forty and pressing a button forty times → Ask for work across repositories |
| An alert fires at 02:00 and you are not at a desk | It lands in Celmis and goes out to the workspace's chat channel, and Fix from here opens a session already holding the alert. The runner opens the pull request → Alerts, and fixing from a phone |
| Your own agent or editor needs to understand the codebase | Point it at /mcp/. Fifty-one tools over the same index, thirty-five of them read-only, under the same access rules — no second copy of your code anywhere → Connect Claude Code and other MCP clients |
The first three are the ones a code-review tool does not do at all, and they are the reason this is a platform rather than a reviewer: index once, then read that index from whichever side of the work you are standing on.
#Three numbers
| 197 seconds | from git clone to six healthy services, measured on a clean server |
| $0.118 | per pull request reviewed, on the model this ships with |
| 17th of 50 | on the Martian Code Review Bench offline set, under all three judges |
That last one is deliberately unflattering, and it stays. It measures one of the surfaces below — pull-request review on isolated single-repository PRs — and that set has no sibling service for a symbol to have consumers in, so the thing this product is built around is not in the number at all. The table, the audit of every finding it scored false, and the command that reproduces both are in Results.
#Quick start
#What you need
| Docker | 24+ with Compose v2 | Docker Desktop on macOS/Windows, the native engine on Linux |
| A model API key | one of | Google Gemini, Anthropic, OpenAI, OpenRouter, Groq or Mistral. A free Gemini key is enough to evaluate: https://aistudio.google.com/app/apikey |
| RAM | ~4 GB free | Measured on a real indexing run: 1.1 GB peak across all five containers, 565 MB at rest |
Postgres and Qdrant are bundled — no external cluster to provision. No Python or Node.js install is needed for the Docker flow.
#Start it
git clone https://github.com/Celmis-labs/Celmis.git celmis
cd celmis

# Generates .env and fills every secret in the format each one needs.
# Idempotent: run it again after a pull and it fills only the new blanks.
./scripts/init-env.sh

docker compose --env-file .env up -d

# Wait for healthy — first boot pulls three images and applies migrations
docker compose ps
Open http://localhost.
Nothing is built here. The three images are pulled from the registry named by
CELMIS_REGISTRY at the tag in CELMIS_TAG, for linux/amd64 and
linux/arm64 — Apple Silicon and an ARM server both get a native image.
Building them on the machine that runs them was measured at 485 seconds and
4.2GB of disk for api alone, which is why installing no longer means
compiling.
Port 80, not 3000: a reverse proxy puts the app and its API on one origin and
serves the API under /backend. That is not a deployment preference — the
browser bundle asks for a relative path, which is the only way one published
image can serve every installation instead of just the one it was built on.
To work ON Celmis rather than run it, add the dev overlay and you get local builds back:
docker compose -f docker-compose.yml -f docker-compose.dev.yml up -d --build
init-env.sh --check reports what is still empty without writing anything.
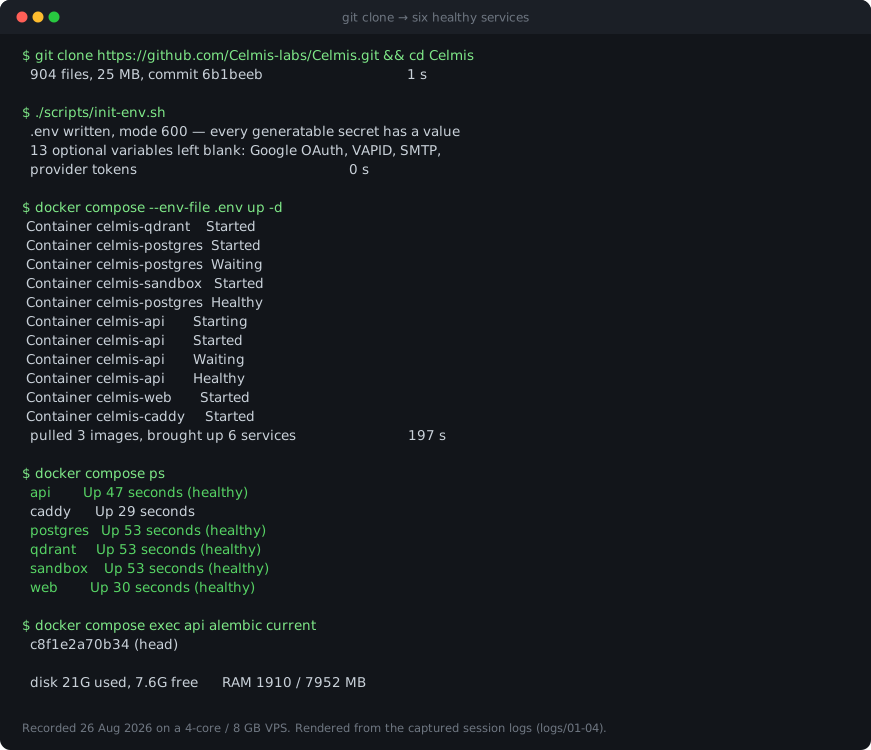
That is a render of the captured session, not a screen recording — the
figures in it are the ones the run produced on 26 August 2026, and the compose
output is verbatim from logs/03-up.log in the install report. It is drawn
rather than photographed because a second stack cannot be brought up beside a
running one: docker-compose.yml fixes container_name, so the names collide.
#Stop
docker compose down       # stop, keep your data
docker compose down -v    # stop and DELETE every volume
#First user and admin
The sign-up form on /login works as soon as the stack is healthy. That
account is a normal user — signing up grants no admin rights, not even to
the first person through the door.
Global admin comes from the environment instead: sign in with
CELMIS_MASTER_EMAIL and CELMIS_MASTER_KEY (as the password), both in
.env. Whoever runs the box is the admin, which is the model a self-hosted
install wants rather than whoever reached the form first. The path does not
exist unless both variables are set, and every use of it is written to the
audit log.
To promote a normal account:
docker compose exec api analyzer auth make-admin you@example.com
A promoted account (or one an OIDC_ADMIN_ROLE makes admin) is a global
admin: system status, ops, compliance, every workspace visible. It is not
the superadmin — that is the master account alone, and it is the only one
that can hand out the roles below that carry power.
#Workspace roles
Every workspace is a tenant, and a person can hold a different role in each — admin of one, editor of two others.
| Role | Can do in that workspace |
|---|---|
viewer |
read |
member |
read; change a review issue's status |
editor |
the prompt editor: agent system prompts, per-repo review policies (prompt template, folder rules, per-agent prompt overrides), analytics. No members, invites, teams, LLM keys, git connections or licence |
admin |
editor's rights, plus members and viewers, invites, teams, LLM keys, git connections |
owner |
admin's rights, plus deleting the workspace |
Who may grant what:
- owner, admin, editor — the superadmin only: granting, changing to or from, removing. A workspace admin cannot demote the owner or another admin.
- member, viewer — the superadmin, or that workspace's owner/admin (directly or by invite; an invite carries only a role its creator could grant, re-checked when it is accepted). An existing account is added directly only if you already share a workspace with it; anyone else receives an invitation they have to accept.
- Password-reset links a workspace admin mints are bounded by every workspace the person belongs to, not just this one. In multi-tenant mode everyone owns a personal workspace, so in practice only the superadmin can mint one. No route mints one for the master account.
- Shared workspaces are created by the superadmin. Everybody gets a personal workspace of their own at sign-up and is its owner.
The superadmin manages people across workspaces on Administration →
Users (/admin/users); every membership change, from any page, is written
to the audit log with the actor, the person, the workspace and the old and
new role. Its No team access filter lists the accounts whose only
workspace is their personal one — whatever way they sign in — newest first.
#Getting in: invites and access requests
An invite for somebody without an account. Inviting an email address
that has no account creates an email-bound, single-use link. The inviter sees
it (copy it from the Team page); when SMTP is configured it is also emailed.
Opened signed out, /invite/<token> shows the workspace, the role and who
sent it, and offers sign-in, sign-up (when AUTH_PASSWORD_LOGIN allows it),
Google and company SSO (when enabled); each comes back to the link to accept.
Accepting re-checks that the inviter may still grant that role, is audited,
and uses the link up. An expired, revoked or used link says which; an
email-bound link opened by another account is refused.
Automatic redemption — verified addresses only. When somebody signs in
with Google or company SSO and the identity provider marks the email as
verified (email_verified), the pending invites addressed to that email are
redeemed at sign-in, through the same accept path (grant rule re-checked,
audited, single use). A password account is never redeemed by its
address: Celmis does not verify the address typed at sign-up, so anyone can
register somebody else's email. A password account opens the link it was
sent, and accepts there — and so does an account that has a password and
Google/SSO linked to it, since whoever set that password can still sign in.
The automatic path only ever adds somebody: an invite for a workspace the
person is already in is used up without touching their role, and removing a
member revokes the live invites addressed to them for that workspace.
Access requests. A signed-in person whose only workspace is their
personal one sees "You have no access to team workspaces yet — send a
request" on the dashboard and at /access-request, with an optional comment
(up to 1000 characters). One pending request at a time; it can be cancelled,
and a new one sent after a rejection. The request names no workspace, and the
requester is shown none until it is approved. The superadmin only decides,
on Administration → Access requests (/admin/access-requests): approve
with one or more (workspace, role) pairs — applied all or nothing, each
membership audited with via="access_request" — or reject with a reason the
requester reads. Access given another way (the Users page, an accepted
invite) closes a pending request as approved. Decided requests stay listed as
history. The requester sees
the decision on /access-request and as a toast on their next visit, and an
approved workspace appears in the switcher without signing out. With SMTP
configured the requester is also emailed the decision, and the master address
a new request; there is no other notification channel.
POST /api/access-requests {comment?} |
ask (409 if one is pending, or the account already has team access) |
GET /api/access-requests/me |
eligibility and the latest request |
DELETE /api/access-requests/me |
cancel the pending one |
GET /api/admin/access-requests?status= |
superadmin: list, pending first |
POST /api/admin/access-requests/{id}/approve {grants:[{workspace_id, role}]} |
superadmin: one or more, unique, existing, not personal workspaces |
POST /api/admin/access-requests/{id}/reject {reason} |
superadmin: reason required |
Deciding a request that is no longer pending answers 409.
#Connect a repository
- Settings → LLM Setup — paste a provider key. It is encrypted with
CREDENTIAL_MASTER_KEYbefore it touches the database, and the UI only ever shows you the first and last four characters again. - Connections — add a GitHub, GitLab or Bitbucket token. Use a machine account, not your own: a personal token reaches every repository you can see, and tokens end up in backups, logs and screenshots.
- Repositories → Add — pick repositories from the provider, or paste a clone URL. Indexing is queued; the job shows on the same page.
Indexing builds two things from the same checkout: a symbol graph (definitions, calls, imports — what the review agents reason over) and embeddings in Qdrant (what Q&A retrieves). A 120k-symbol repository takes about a minute on four cores.
Twenty-three languages parse into the graph. A file in a language without a
parser is said so out loud rather than silently skipped — analyzer graph-stats
lists what was and was not read.
#Ask the code
A question in a chat, answered with file:line citations from as many repositories as you point it at. Answers stream as they are written.
Group repositories into a project, and the question is asked of the group:
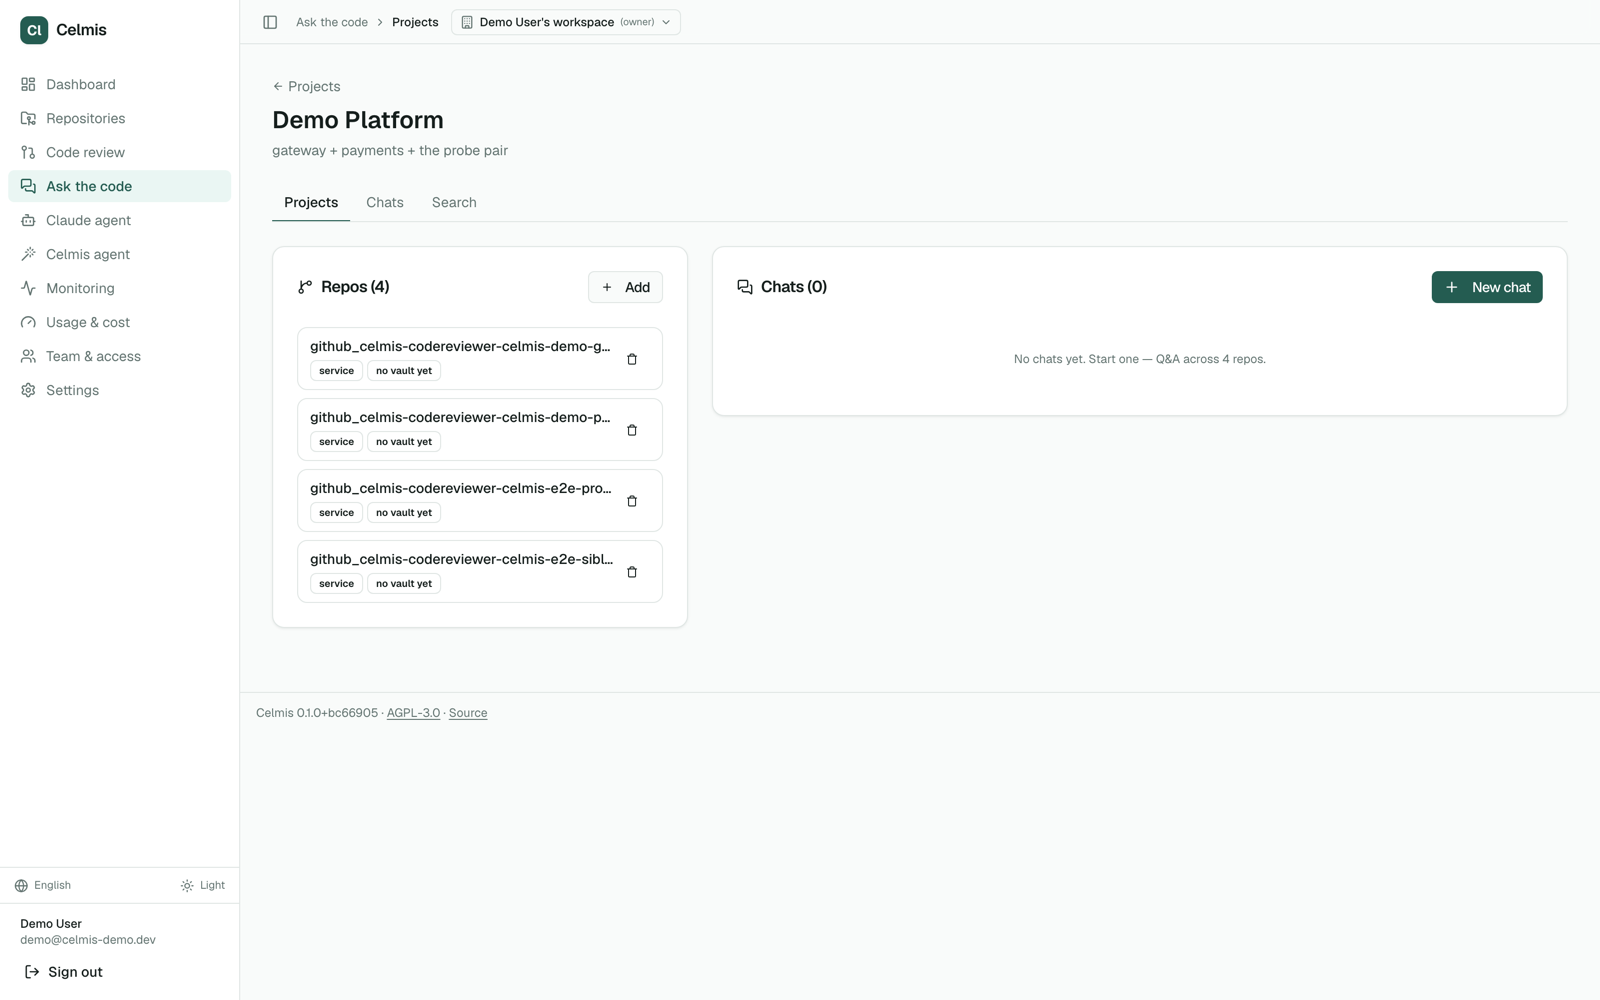
Answers quote real code, and only the code the asker is allowed to see — which is what makes it safe to hand the question to someone outside the team that owns the repository. See Who can see what.
#Pull-request review
Agents read the diff and post findings to GitHub, GitLab or Bitbucket. Rather than show that in a screenshot of this interface, the reviews are left where they were posted — fifty pull requests on real projects, with the comments still attached to the lines they were written about. They are listed under Test repositories, and the output there is unedited, including the findings the audit below marks wrong.
Where the graph is built, the review also carries what the diff does not show: who else calls the symbol being changed, including from another repository. Where it is not built, the review still runs — it just answers the narrower question, which is what the benchmark measured.
#Talking to the reviewer, and what it learns
Beyond the first review, the reviewer works inside the pull request:
- Comment commands.
@celmis help,start-review,review --force,remember: <rule>, and a free-text question answered in the same thread (PR commands). - Incremental review and cadence. A new push is reviewed from the last reviewed commit; a repository can pause automatic reviews after a burst of pushes, skip titles by keyword, and write the overview into the description (Review settings).
- Team memories and learning. Rules the team states, and findings it dismisses, shape later reviews, with a shadow mode to judge the effect first (Memories and learning).
- Issues backlog. Findings are followed across pushes and after the merge, and resolve themselves when the code shows the defect is gone (Issues backlog).
- Jira task context. The business-logic agent checks the change against the task a pull request names, with an acceptance-criteria checklist (Jira).
- Productivity metrics. Cycle time and the four DORA measures from your pull request history, for owners and admins (Productivity).
- Who can see what. Roles and access. Every one of these features reads a repository only for people who may read it, by the same rule as MCP (MCP access); chat replies and the Jira check never quote code the asker cannot open.
- A compact MCP profile for coding assistants.
/mcp/devserves nine read-only tools sized for an editor, withhowtofor "how does this service do auth" and a Claude Code plugin (The developer profile, howto).
Every finding the benchmark scored false was opened in the source and published with a verdict. Thirty-three of seventy-nine turned out to be real defects the gold set does not contain. That work is in Audit of the false positives, with the code and a permalink for each, so you can disagree with any of them.
#Dependencies, SBOM and the evidence pack
The dependency audit is deterministic: native auditors where the tool is installed, OSV everywhere else, no model involved. A language model, if you give it a key, writes the summary — it does not decide what is vulnerable.
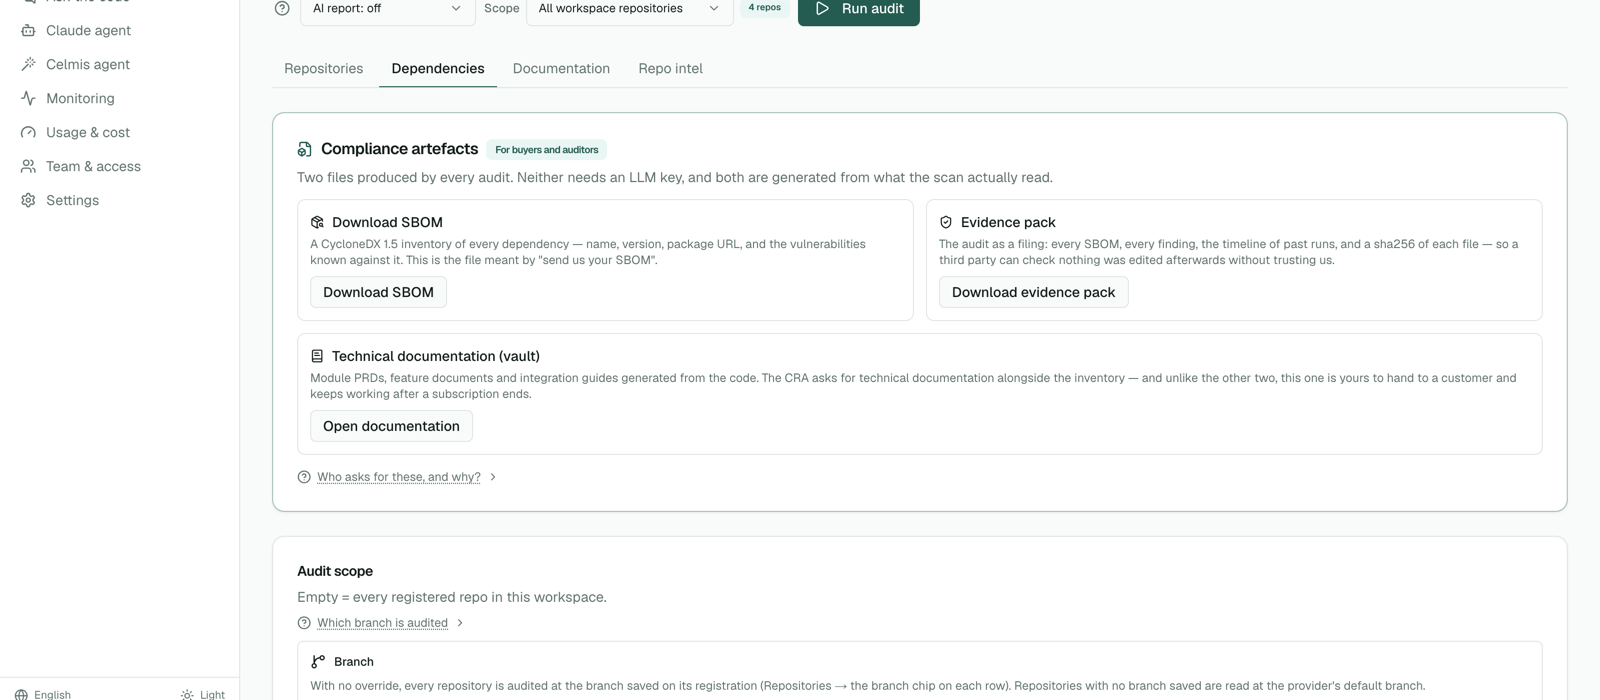
Two files come out of every audit, and neither needs an LLM key:
-
SBOM — a CycloneDX inventory of every dependency, its version, package URL and the vulnerabilities known against it. This is the file people mean when they say "send us your SBOM".
-
Evidence pack — the audit as a filing: every SBOM, every finding, the timeline of past runs, and a sha256 of each file. Those hashes prove the archive is internally consistent; they do not on their own prove it is the archive that left here, because the manifest records no hash for itself and anyone who edits a file can rewrite its entry. The export returns the manifest's own sha256 in
X-Celmis-Manifest-SHA256— publish that where the pack is not, and a third party can then check it without having to trust us, against a value you did not hand them with the file. A folder whose contents can be changed later proves nothing; the manifest is what makes it evidence.That last sentence used to be a claim nobody could act on: checking a pack meant cloning this repository and installing forty dependencies under Python 3.13 — the producer's whole toolchain, to check the producer's output. The check is now its own package, with no dependencies and no network calls:
pip install celmis
celmis verify evidence-pack.zip
Any Python from 3.9, offline, on a machine that has never run Celmis. It recomputes every sha256 the manifest lists and reports listed-but-absent, mismatched and present-but-unlisted; exit 0 clean, 1 problems found. This is the verifier only — the platform itself is six services under docker compose and does not install with pip, and the package says so when run with no arguments.
Alongside them, the generated technical documentation — module PRDs, feature documents and integration guides written from the code — which is yours to keep and keeps working after any subscription ends.
Why this exists now. From 11 September 2026 the EU Cyber Resilience Act requires a manufacturer to report an actively exploited vulnerability to ENISA within 24 hours. The formal SBOM mandate lands in December 2027, but you cannot answer the 24-hour question without component-level visibility first — to report what is affected, you have to know what is inside.
Celmis does not claim compliance, and will not. It produces the artefacts a filing needs. Whether a filing is adequate is a lawyer's judgement, and a tool that implies otherwise is selling a false sense of safety.
One more thing the audit page says out loud, because it is the failure nobody looks for: an ecosystem nobody scanned reports zero vulnerabilities exactly like a clean one. Coverage is shown next to the findings — which auditor produced each result, and, more usefully, what went unchecked and why.
#Fix from here
Finding something is half a loop. An embedded Claude Code session runs inside the installation, edits the checkout, and the runner commits, pushes a branch and opens a pull request.
#It runs on your subscription, on your machine
There is no key to buy from us and no model bundled. You connect your own Claude
subscription, the way Cursor does it: run claude setup-token once on your own
laptop and paste the token into Settings. It is stored encrypted in the credential
store, and the session that runs later uses it.
Two slots, resolved in that order:
| Personal | your own subscription, visible to nobody else |
| Workspace | one subscription an admin shares with the workspace — explicit opt-in |
The workspace slot is off unless someone turns it on, and the interface says why before you save: sharing one person's subscription across several people may breach Anthropic's consumer terms. That is a decision for whoever holds the subscription, and the product will not make it quietly.
And the session is not running in somebody's cloud. It runs on your own installation, in a workspace isolated per session. What that buys you is not "cloud access" — it is that the machine holding your code is one you control, and you reach it from a laptop in an office or a phone on a train for the same reason you reach any service you run: because it is yours and it is up.
That is the whole of Alerts, and fixing from a phone — an alert arrives, and the fix starts from wherever you happened to read it.
A vulnerability in the dependency audit carries a Fix from here button. It does not open an empty chat — it hands the session the repository, the package, both versions and the boundaries of the job, already written:
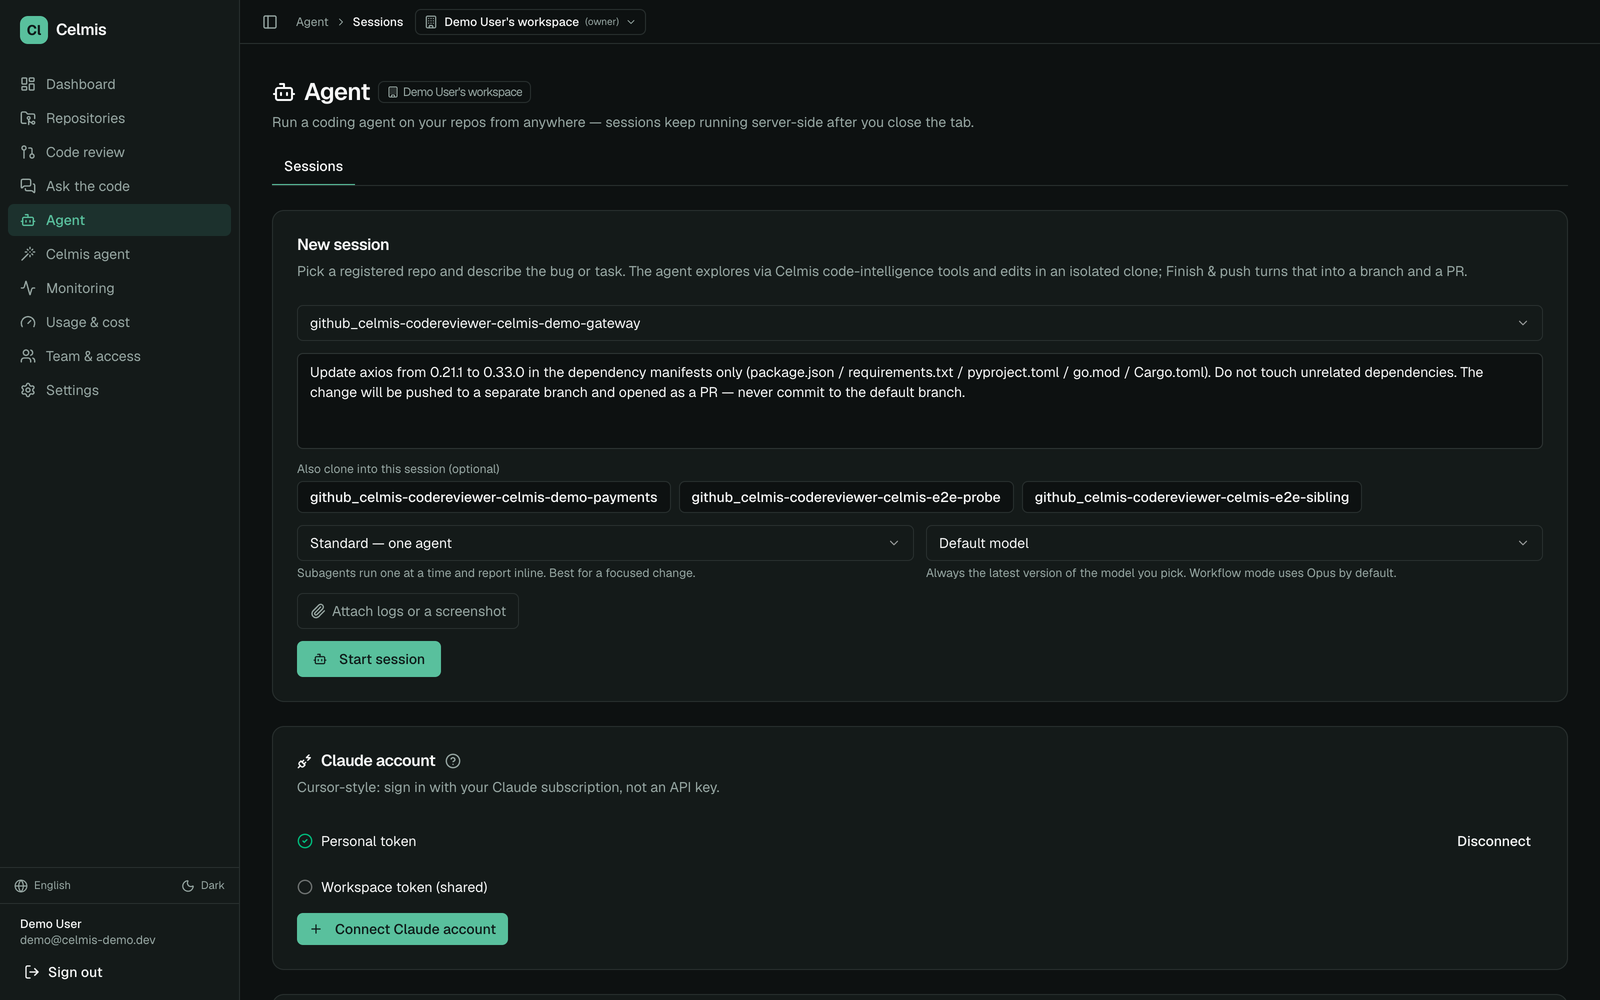
Here is one such loop, end to end, on a real finding — lodash 4.17.11 with a
known vulnerability against it. 220 seconds from Start session to an open
pull request, in five turns:
Read package.json
  → "Only package.json has lodash; no requirements.txt/pyproject/go.mod exist here."
Edit package.json: "lodash": "4.17.11" → "4.18.0"
mcp__exec__run: cat package.json | grep -A2 lodash; ls
  → "Confirmed no other manifest files exist, so no other changes were needed."
The branch it pushed, and the pull request it opened, on GitHub:
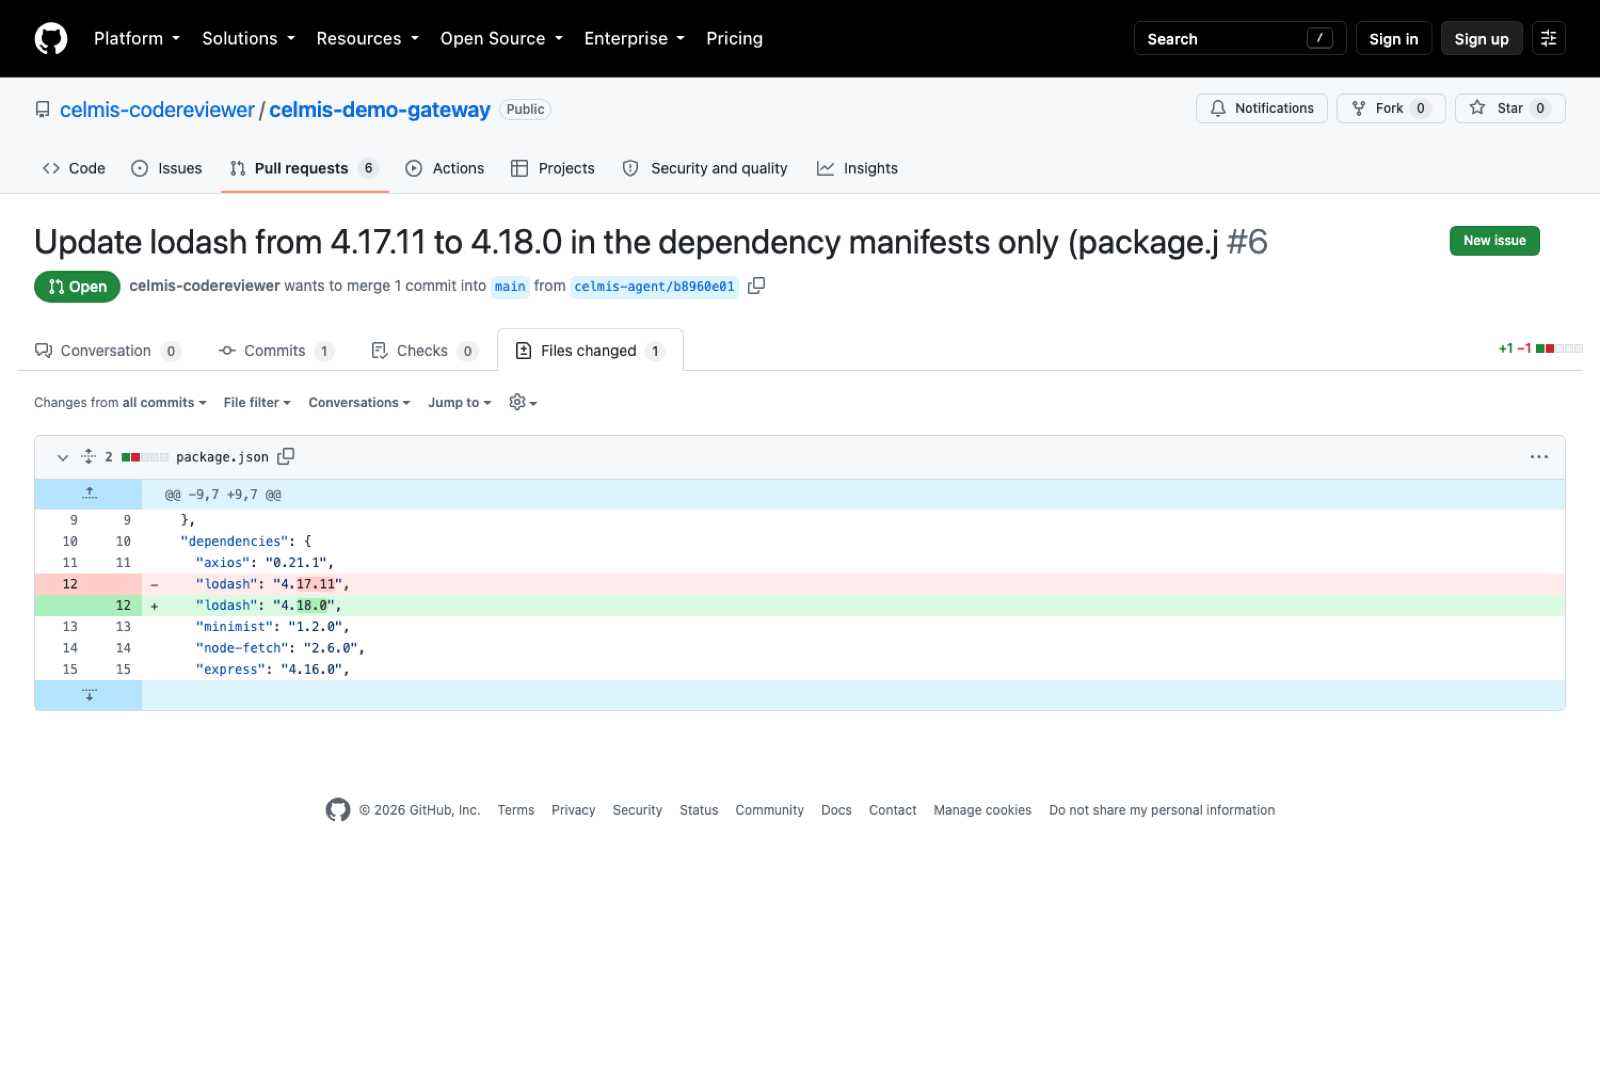
Look at what is not in that diff. axios 0.21.1, minimist 1.2.0,
node-fetch 2.6.0 sit on the lines directly above and below — all outdated, all
flagged in the same audit — and all untouched. The task said manifests only, and
an agent that tidied three more on the way past would have been a worse result
to review, not a better one.
It is a live pull request, not a screenshot:
celmis-demo-gateway#6
— branch celmis-agent/b8960e01, one commit, +1/-1.
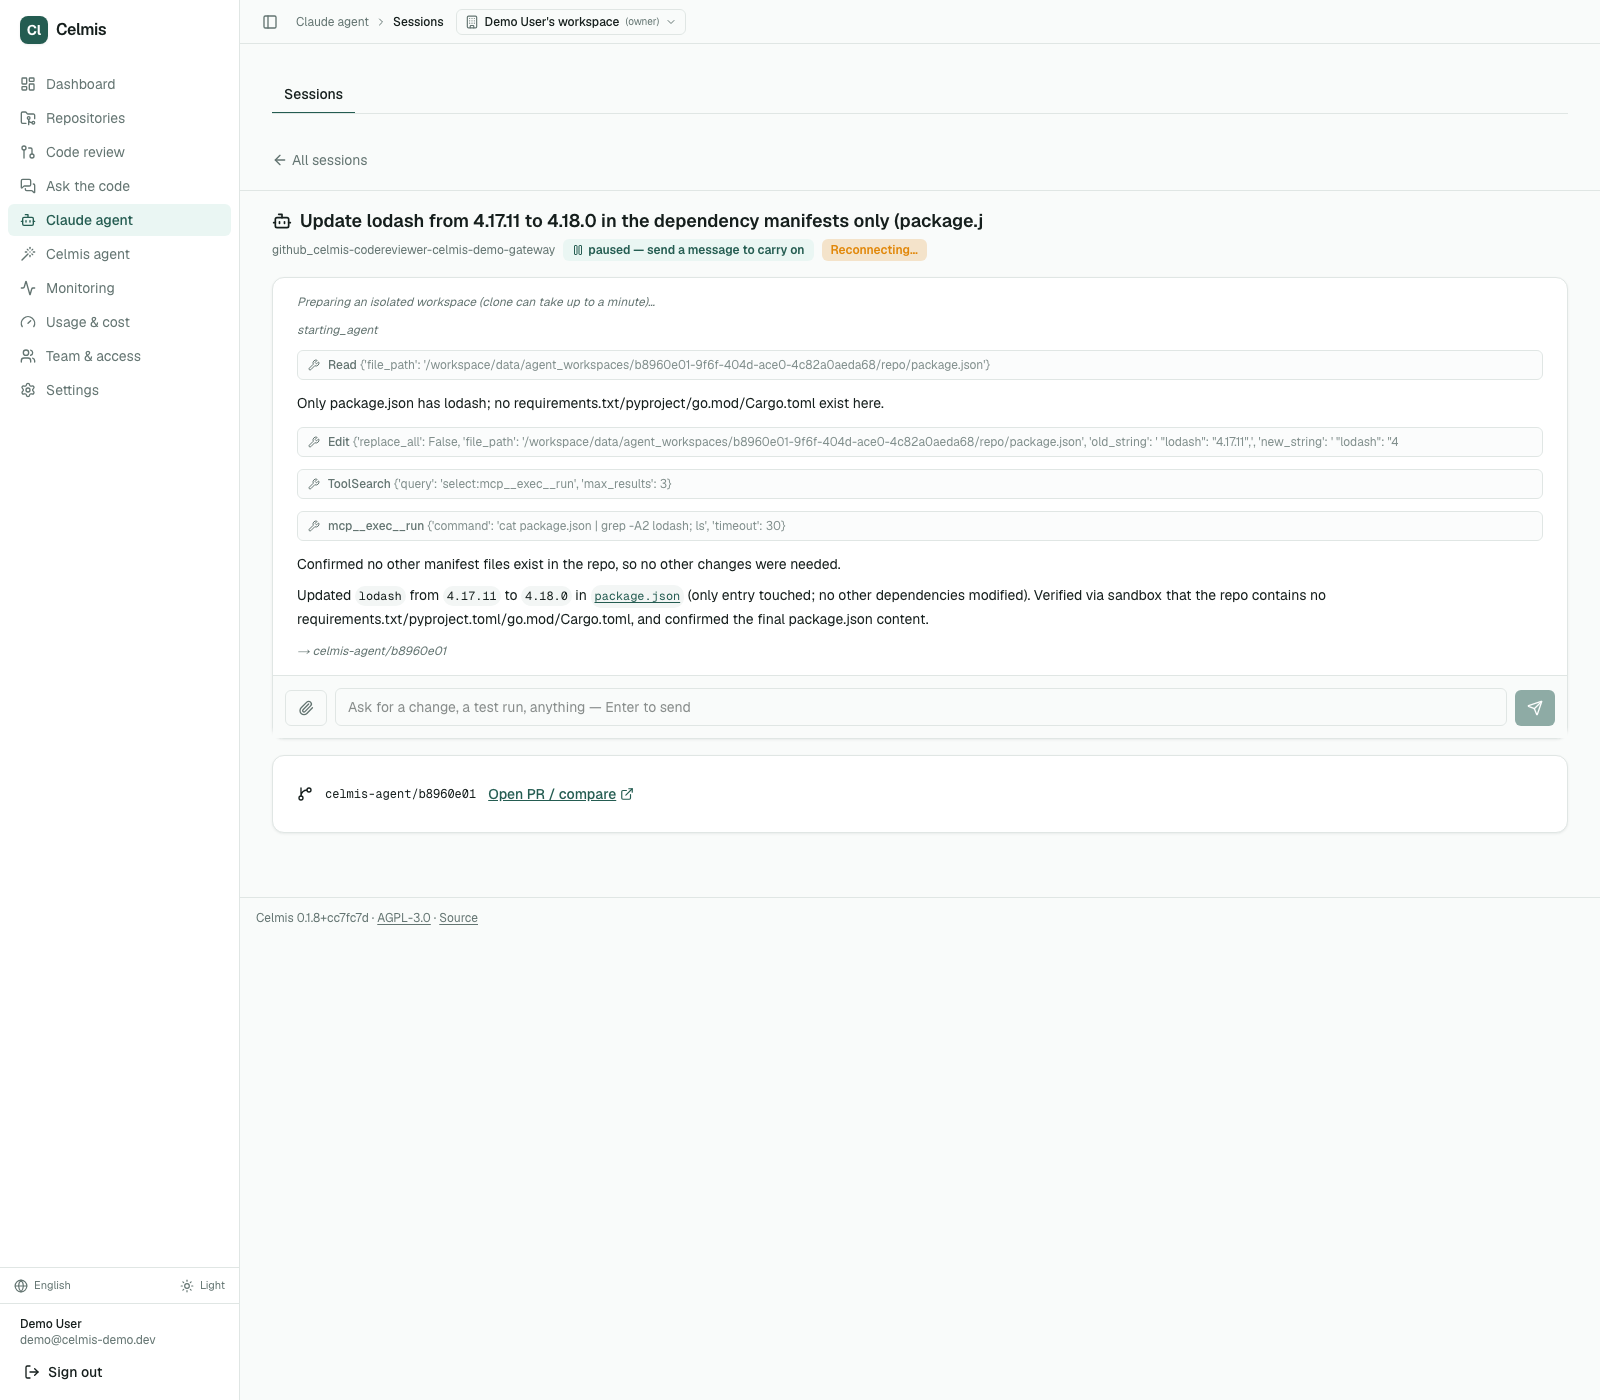
Two details in that transcript are worth more than the diff. The agent did not assume there were no other manifests — it ran a command in the sandbox to check. And the task said "manifests only, do not touch unrelated dependencies", so the change is exactly one line.
#What the runner allows, and what it does not
This is decided by the runner, not by the prompt — which is the part worth reading before you grant an agent anything:
- No shell of its own.
Bash,WebFetch,WebSearchand notebook editing are disallowed. Commands run through the sandbox container, which is a separate service with its own uid and a read-only root filesystem. - Git is the runner's job. The agent never commits or pushes. When the work is done — or when you press Finish & push — the runner makes the commit, pushes the branch and opens the PR. Never to the default branch.
- A provider limit is a pause, not a loss. The first attempt at the run above
hit a weekly account limit mid-session. The session did not die: it moved to
paused, kept its work resumable for fourteen days, and showed the provider's own message rather than a generic failure. A second key finished it. - The session is watchable. Output streams over SSE with replay, so a reconnect picks up where it left off instead of starting blank.
Connection is a setup token, held per user or per workspace. The API never returns it once saved — only whether it is there and whether it still works.
#Alerts, and fixing from a phone
The loop above starts from a dependency finding. It also starts from production.
Point any monitoring system at the workspace's ingest URL and its alerts land in Celmis:
POST /webhook/alerts/{workspace_id}.{secret}
Grafana's unified alerting webhook is parsed as-is; anything else can post
{"title", "body", "severity", "repo"}. The secret half is stored Fernet-encrypted
per workspace and compared in constant time. The endpoint is unauthenticated by
design — monitoring systems cannot do OAuth — and tenant-bound by
construction: a token can only ever write into the workspace it belongs to.
What that buys is the route with no laptop in it:
- An alert fires. It reaches Celmis and goes straight out to whatever channel the workspace has bound — Slack, Discord, Google Chat or a plain webhook — so it finds you where you already are rather than on a page you have to remember to open.
- You open it. The alert carries its repository, because
route_incidentcan take a stack trace and say which repository and which owner it belongs to. - You press Fix from here. The session opens already holding the alert — not an empty chat.
- The runner commits, pushes a branch and opens the pull request.
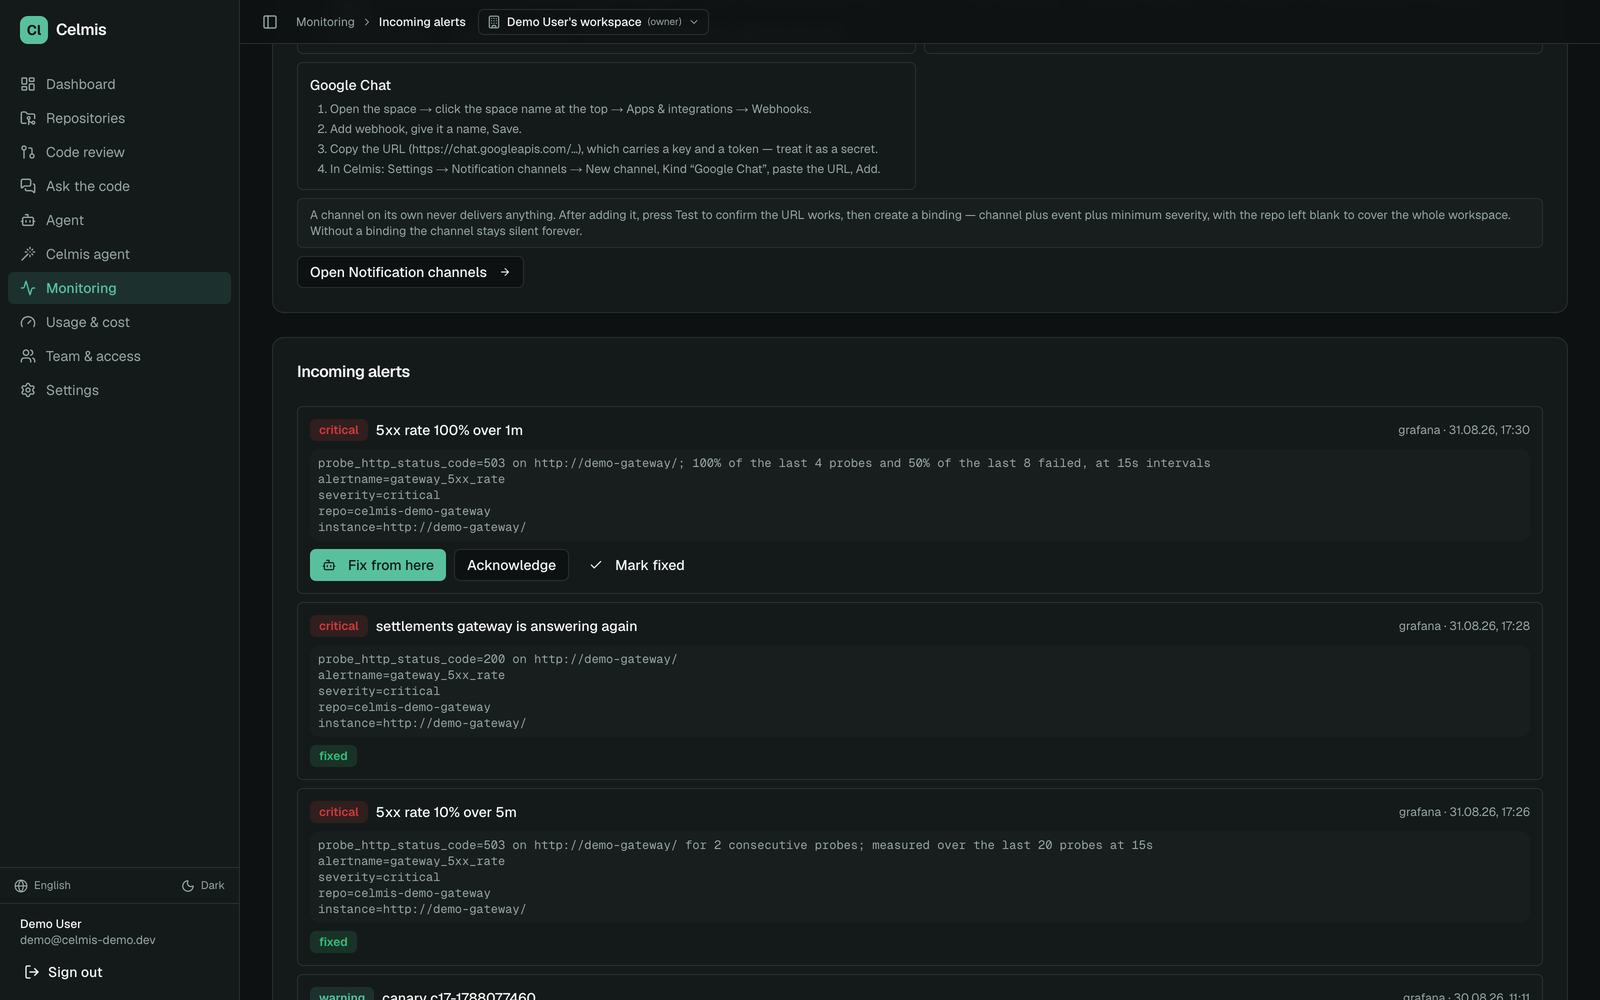
None of those four steps needs a checkout, a terminal, or a machine you trust. The work happens inside your own installation; the phone is a screen for it.
The same page lists every alert the workspace has received, so an alert that nobody acted on is visible rather than lost in a channel.
What is written down while this happens. Two separate records, and they answer different questions:
- The audit trail — append-only JSONL, rotated by size, filterable by time, mode, operation and repository, exportable as CSV. It answers who did what, to which repository, when. Retention defaults to 90 days and the active file is never deleted, only rotated archives.
- Resource history — samples and aggregates over the installation itself, exportable as CSV for a sizing sheet. It answers what did this cost to run.
An agent session that edits a repository at two in the morning from somebody's phone is exactly the kind of event that has to be reconstructable afterwards. It is.
#Ask for work across repositories
Every surface above acts on one thing at a time: this repository, this pull request, this finding. That is the right shape for a button, and the wrong shape for a set defined by a condition.
Generate documentation for every service that has none is one sentence. Through
the interface it is finding them among forty and pressing a button forty times.
Audit everything under acme-ai that has not been audited in thirty days needs
filters, saved selections and bulk operations — a subsystem — or it needs a
sentence.
So there is a sentence box, and a deliberately short catalogue of verbs behind it. Single-object work stays on the buttons, where it belongs.
Nothing runs on the first press. Interpretation is a guess, and these verbs cost money and hours — a vault build, a fleet of review agents, an audit across a group. So the answer to a sentence is not the work; it is which repositories this resolves to, listed, with a second button under them. You confirm the set, not the intent.
The scope is re-checked at the moment you confirm, not when you asked. A repository registered in the seconds between the question and the press cannot quietly join a set that said "everything". The same rule that governs the rest of the product — the check runs where the work happens — governs this.
An automated caller can never enqueue an unbounded fan-out. The verbs are capped, workspace-scoped, and take an explicit actor: nothing here reads an ambient request context, because a connector processing a queue has no request, and a function that guesses at a workspace is the way one tenant's automation reaches another tenant's repositories.
Three callers are converging on these same verbs — an external agent over MCP, the embedded agent, and a ticket connector that turns audit these four services into work and posts the result back. They share one implementation on purpose: a second "start an audit" is a second set of rules about live runs, deduplication and forced restarts, and the copy nobody maintains is the one that corrupts the queue.
#Who can see what
Access is resolved per repository, per team, and it governs every surface at once — Q&A, graph, code search, generated documentation, MCP:
| setting | effect |
|---|---|
visibility: none |
the repository does not exist for research |
visibility: metadata |
documentation and architecture notes only |
visibility: code |
source is readable |
deny_globs |
wins even at code — credentials, crypto, database connections, secret verification |
allow_globs |
an allow-list when set; deny still subtracts from it |
This is what makes the neighbouring-team case work rather than being a promise: load the repository, grant the other team the right to ask, and deny the paths that must not be read. They get answers; those files are refused at the source, not filtered out of a response that already contained them.
#Languages and formats
Seventeen graph modules, plus a generic path through tree-sitter tag queries for languages without one:
Code — Python, TypeScript, JavaScript, Go, Java, C#, C++, PHP, Vue, and more through the generic path.
Infrastructure — Dockerfile, docker-compose, Helm, Kubernetes manifests, Terraform and CI workflows. This is the part most code-intelligence tools skip, and it is why a question can cross from a function to the service definition that runs it.
#Deterministic checks — no model, no false positives
Every check below is decided by reading files. No language model takes part in deciding that something is wrong, so the false-positive rate is zero by construction rather than by tuning.
That distinction is the whole point. Around twenty percent false positives is where developers stop reading a tool's comments at all — one costs seconds of attention, a thousand costs you a team that has learned to skip everything the tool says. A model is used here to explain and to prioritise, never to detect.
| Check | Reads | Catches |
|---|---|---|
install_script |
package.json lifecycle hooks |
a dependency that runs code at install time |
python_build_hooks |
pyproject.toml / setup.py |
build-time code execution in a Python package |
cargo_build_script |
Cargo.toml |
a crate with a build.rs |
non_registry |
manifests and lock files | a dependency pulled from a git URL or tarball instead of a registry |
suspect_name |
the dependency list | typosquats — a name one edit away from a popular package |
lock_drift |
manifest vs lock file | a lock file that no longer matches what the manifest declares |
cross_repo_drift |
the PR diff, then sibling repositories | a constant changed in one repository and left behind in the others |
Ordinary CVE scanning is deliberately not on that list. OSV-Scanner already
does it, it is free, and it is the de-facto standard — Celmis runs it (plus each
ecosystem's own auditor: pip-audit, npm audit, govulncheck,
cargo audit) and treats the result as an input rather than as a feature.
On compliance. Celmis produces the artefacts an audit asks for — a CycloneDX SBOM, a dependency inventory, a findings history with timestamps and the evidence each finding rests on. It does not claim your filing is adequate, and no tool honestly can: what an auditor accepts depends on your sector, your jurisdiction and your own controls. Produce the artefacts; let the people whose job it is assess them.
#Connect Claude Code and other MCP clients
Celmis exposes its index over MCP, so an agent can search symbols, read API surfaces and find consumers instead of grepping a checkout it does not have.
Over HTTP (the running stack serves it at /mcp/):
# A token is per person and names the repositories it may read. The
# superadmin issues it (Administration, MCP tokens) or on the server:
docker compose exec api analyzer mcp issue-token \
  --user dev@example.com --workspace acme --repos 'acme/shop-*' --days 30
The token never reaches a repository its person cannot read, and every call is audited. A repository nobody has a rule for is closed to members. How access, tokens and the audit work is in MCP access.
// ~/.claude.json  (or .mcp.json in a project)
{
  "mcpServers": {
    "celmis": {
      "type": "http",
      "url": "http://localhost:8000/mcp/",
      "headers": { "Authorization": "Bearer <the token you just minted>" }
    }
  }
}
One project, for an outside client. On a project's page the superadmin can
create a project token (cmcp_..., one hour to 90 days, shown once, revocable).
It reaches only that project's repositories, narrowed by the project's file
scope, through two tools, search_project and ask_project. Details and the
claude mcp add command are in Archives and project tokens.
Over stdio, without the HTTP hop:
{
  "mcpServers": {
    "celmis": {
      "command": "docker",
      "args": ["compose", "exec", "-T", "api", "analyzer", "mcp", "serve"]
    }
  }
}
#What an agent can ask
The HTTP mount serves 51 tools, and a client does not necessarily see all of
them. Thirty-five are read-only; the sixteen that write — add_repo,
start_dep_audit, cancel_dep_audit, generate_docs, set_auto_review,
migrate_consumers, ack_alert, retry_job, cancel_job, set_budget,
update_review_setting, propose_review_rules, generate_review_rules,
review_pr, index_repo, update_issue —
require a write scope (write:repos, write:config, write:reviews) that a
default token does not carry, so they are absent from a read client's tool list
and refused if called by name. This is what the read-only ones answer, and they are
the questions a grep cannot:
list_workspace_repos |
which repositories exist, indexed, documented, auto-review on |
search_symbols |
where a function or endpoint is defined, across a whole project |
find_consumers |
which repositories call a symbol — including ones you never cloned |
get_api_surface |
the HTTP handlers a service actually exposes |
get_owner · list_deprecations |
who owns a file; what is on the way out and who still uses it |
route_incident |
given a stack trace, which repository and owner it belongs to |
bootstrap_client · start_integration_walk |
what a client needs to call another team's service |
get_dep_audit · list_dep_findings |
the last audit and its findings, worst first |
get_review · get_review_policy |
the latest review of a PR, and which agents run where |
list_reviews · get_review_run |
the newest review runs, and one run's findings (by run id, or repo + PR number) |
list_issues |
tracked review issues, worst first, with counts per status |
ask_code · search_code |
a written answer about the code (one model call, booked as Q&A); symbol, usages, owner and architecture lookups |
The HTTP mount also writes with review_pr (queue a review of one PR or every open one), index_repo and update_issue (set an issue's status), all behind write:repos.
| get_review_settings | the review settings in force and where each value comes from |
| get_spend · get_usage · get_budget | LLM spend by model, surface and day; review usage; the monthly cap |
| list_alerts · list_jobs | incoming alerts; background jobs with counts per status |
| audit_delta · export_sbom | what changed since the previous audit; the SBOM download URL |
| list_members | workspace members with roles and teams |
| howto | how a repository does one thing (db, auth, config, http_client, logging, messaging, cache): code slices, the env and setting names it reads and where their values come from, never the values; needs read:graph on /mcp/, read:code on /mcp/dev/ |
The two transports are not the same set. analyzer mcp serve over stdio
serves 13 older, graph-shaped tools (find_symbol, find_callers,
query_graph); the HTTP mount serves the 35 read-only ones (the two project-token tools, search_project and ask_project, among them). Neither is a subset of the
other — pick the transport for the tools you want.
A step-by-step guide, with the scopes each tool needs and the failure modes,
is in .claude/skills/celmis-mcp/SKILL.md.
Claude Code picks it up automatically when this repository is open.
#What the agent can ask for
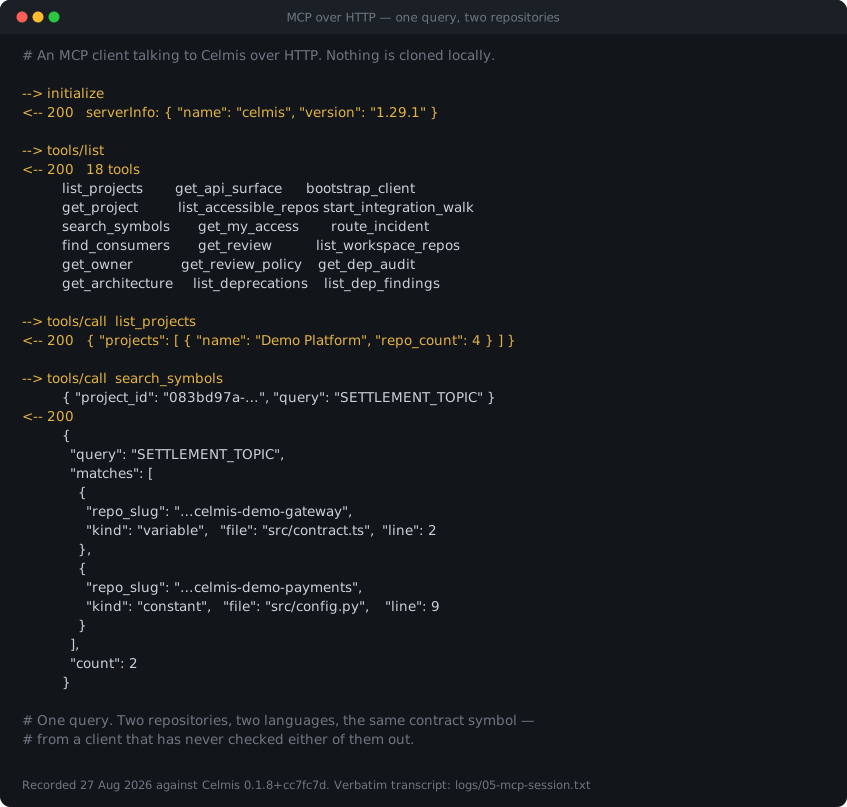
One search_symbols call, one contract symbol, and it comes back from two
repositories in two languages — to a client that has checked out neither. The
boundary a diff never crosses is the one this makes ordinary.
The table below is the stdio server's graph-shaped set (analyzer mcp serve, 13 tools).
The HTTP mount at /mcp/ serves 51 tools in all (35 read, 16 write) over Streamable HTTP,
authenticated like /api/, and a token sees only the ones its scopes allow. The graph
lookups:
| Tool | Answers |
|---|---|
list_repos |
which repositories are indexed, and how fresh each index is |
list_groups |
which repositories are grouped together, so cross-repo questions have a scope |
find_symbol |
where a name is defined, across every indexed repository |
get_symbol |
the definition itself, with its file and line range |
find_callers |
what calls this — the question a grep answers badly and a graph answers exactly |
find_callees |
what this calls, one hop out |
cross_repo_edges |
calls that cross a repository boundary |
query_graph |
read-only Cypher, for questions the seven above do not shape |
cross_repo_edges is the one worth understanding, because it is the reason this
product carries a symbol graph at all. A diff-only reviewer — every tool in the
benchmark table above, including this one when the graph is empty — can tell you
that a function signature changed. It cannot tell you that a service in a
different repository still calls the old shape, because it never had that
repository open. Group the repositories once, and that question becomes
answerable:
> which services outside this repo call PaymentGateway.charge?
This is also why our benchmark rank understates the product rather than describing it: the benchmark set is isolated single-repository pull requests, so there is no sibling repository for an edge to cross. The capability is real and the benchmark cannot see it — which is a statement about the benchmark, not a claim you should take on faith. Point an MCP client at your own group and check.
#Results
Celmis was run on the Martian Code Review Bench
offline set: 50 curated pull requests, 173 human-written golden comments, scored
against the gold set by an LLM judge. Measured on e0db376 with
gemini-3.6-flash at temperature 0.1, no reasoning tokens.
| Judge | F1 | Precision | Recall | Rank |
|---|---|---|---|---|
| claude-opus-4.5 | 47.5% | 52.4% | 43.4% | 17 / 50 |
| claude-sonnet-4.5 | 44.9% | 48.0% | 42.2% | 17 / 50 |
| gpt-5.2 | 42.7% | 46.0% | 39.9% | 17 / 50 |
The F1 moves 4.8 points depending on who judges. The rank does not move at all — seventeenth under all three.
The whole run cost $5.88 — $0.118 per pull request — and produced 153 findings, 3.06 per PR (defect 114, security 27, contract 6, structural 6).
Why this comparison is fair. Martian ships its own evaluations of 49 tools in the benchmark repository, produced by the same three judges on the same 50 PRs against the same goldens. We did not re-score anybody: their rows are taken as published and ours is appended. Reproduce the whole table with:
python3 autoloop/offline_table.py anthropic_claude-sonnet-4-5-20250929
Offline is not the public leaderboard. Martian runs two benchmarks. The public leaderboard is the online one — 200,000 real pull requests scored by what developers actually fixed. This table is the offline one — 50 curated PRs scored against a gold set. They measure different things and the numbers are not interchangeable. Claims of the form "tool X is #1 on Martian" usually refer to the online table, a different metric, or a different judge.
What this number does not contain. The graph was empty for all 50 PRs
(graph_status null, drift empty on every one), because the benchmark set is
isolated single-repository pull requests — there is no sibling service for a
symbol to have consumers in. Cross-repository drift, the thing this product
carries a symbol graph for, contributed exactly nothing to the score above. It
is not measurable here, and we are not claiming it from this table. See
Test repositories to watch it work on real code instead.
#Audit of the false positives
Benchmark scoring has a structural floor: the judge matches our comment against a finite list of human-written goldens, so a correct finding the annotator never wrote down is counted false by construction. We opened all 79 of ours in the source at the measured commit and assigned a verdict to each.
Of 79 findings scored as false positives, 33 are real defects the gold set does not contain, 38 are genuinely wrong, and 8 could not be settled from the code. That puts the true precision of this run between 69.7% and 75.0% rather than the measured 48.0% — but that corrected figure cannot be compared with anything in the table above, because nobody has audited the other tools the same way and their false positives almost certainly contain a similar share of real defects; for comparison with other tools the measured 48.0% is the honest number, because it is the same method applied to everyone.
Twenty-four of the 38 genuinely-wrong findings share four root causes, and none
of them is "the model is weak" — all four are about what the model was shown.
The largest is an identifier declared in the same file but outside the excerpt
the agent received: a method parameter 26 lines up, an import on line 3, an
attr_reader on line 18.
The full report gives the claim, the code at that commit, the verdict, the reasoning and a permalink for each of the 79, so any verdict can be disputed with the same evidence in front of you.
#Test repositories
Every review in the run above is still live and public. These are real pull requests from real projects, forked with their history, carrying the inline comments Celmis wrote:
| Fork | PRs |
|---|---|
| celmis-bench/keycloak | 9 |
| celmis-bench/grafana | 10 |
| celmis-bench/discourse-graphite | 10 |
| celmis-bench/cal.diy | 10 |
| celmis-bench/sentry | 6 |
| celmis-bench/sentry-greptile | 4 |
Worth opening first:
- keycloak#17 — a null dereference and a recovery-code indexing question in Keycloak's test storage provider
- grafana#16 — a Storage failure recorded against the Legacy metric, one of three instances of the same mistake in that file
- cal.diy#11 —
forEachwith an async callback, so the deletions are fire-and-forget and the surroundingtrycatches nothing - sentry#11 — seven inline comments on one Kafka consumer PR
You are reading unedited output, including the findings the audit above marks wrong. Nothing was removed after scoring.
#Configuration
./scripts/init-env.sh writes .env from .env.example and
generates every secret. The example ships each secret empty on purpose: a
previous version put the generating command beside the variable, dotenv files
have no inline comments, and every install that copied it ran with a master
password printed in the repository.
Settings reach the containers only through the environment: block in
docker-compose.yml — the image carries no .env. A variable not named there
takes its code default no matter what your .env says.
GET /healthz reports the review clocks as the process actually resolved them,
which is how you check what arrived.
The clocks are documented as a set in .env.example, with the invariant that
binds them:
REVIEW_LLM_TIMEOUT_SECONDS × (1 + RETRY_FACTOR) ≤ REVIEW_TIMEOUT_SECONDS
Raise one and the other has to follow; a test enforces it.
| Variable | Default | |
|---|---|---|
REVIEW_TIMEOUT_SECONDS |
900 | wall clock for one review; past it the tail stages stand down and the comment says so |
REVIEW_LLM_TIMEOUT_SECONDS |
300 | one model call. Raise to ~600 for a slow reasoning model |
REVIEW_LLM_TIMEOUT_RETRY_FACTOR |
2.0 | how much longer the retry gets after a timeout; 1.0 disables the widening |
REVIEW_MAX_DIFF_SIZE_BYTES |
500000 | larger diffs are refused, not truncated |
REVIEW_VERIFIER_ENABLED |
false | the LLM false-positive veto |
REVIEW_AGENT_CONCURRENCY |
3 | provider calls in flight per review |
CELMIS_JOB_LEASE_SECONDS |
600 | ceiling on worker silence before a job may be reclaimed |
CELMIS_DEPLOYMENT_MODE |
single_tenant | multi_tenant isolates workspaces from each other |
#Operations
docker compose logs -f api            # follow the API
docker compose exec api analyzer graph-stats <repo>   # what parsed, what did not
./scripts/backup.sh                   # Postgres + volumes
./scripts/restore.sh <archive>
Admin → Monitoring shows queue depth, spend per workspace and per-agent model settings. Usage & cost breaks spend down by surface, so a batch documentation build does not read as chat.
Deploy to a server is ./scripts/deploy-on-server.sh v0.1.0, run on the
server: it pulls the published images, brings the stack up behind Caddy and
stamps the build the AGPL footer links to. Nothing outside that machine needs a
credential for it. See
docs/ORACLE_CICD.md, or
docs/HETZNER.md for a plain VM.
#Local development
# Postgres and Qdrant from compose, everything else on the host
docker compose up -d postgres qdrant

python -m venv .venv && source .venv/bin/activate
pip install -e ".[dev]"

alembic upgrade head
uvicorn src.api.main:app --reload --port 8000

cd web && npm install && npm run dev     # http://localhost:3000
pytest -q                # the suite
ruff check .             # lint, ratcheted at zero
cd web && npx tsc --noEmit
#CLI reference
analyzer is installed by pip install -e .; inside Docker use
docker compose exec api analyzer …. Every command takes --help.
analyzer init |
create the workspace layout |
analyzer index <path|url> |
parse a repository into the graph |
analyzer ask "<question>" |
one question, cited answer |
analyzer chat |
interactive session |
analyzer review <provider> <repo> <pr> |
review a pull request; --post publishes |
analyzer generate |
build the documentation vault |
analyzer refresh |
re-index what changed |
analyzer graph-stats <repo> |
what parsed, per language |
analyzer serve |
the API without Docker |
analyzer review-serve |
the webhook receiver alone |
Grouped subcommands: analyzer repo, analyzer group, analyzer auth,
analyzer mcp, analyzer scip.
#Architecture
                      ┌──────────────┐
   GitHub / GitLab ──▶│   webhook    │──┐
   Bitbucket          └──────────────┘  │
                                        ▼
   Browser ──▶ web (Next.js) ──▶ api (FastAPI) ──▶ Postgres   jobs, policies, audit
                                     │              Qdrant     embeddings
                                     │              sandbox    untrusted execution
                                     ▼
                              model provider
                       (direct, or via a LiteLLM gateway)
- Postgres holds jobs, policies, run history, spend and the audit log. The
durable job queue is a table — dequeue is
SELECT … FOR UPDATE SKIP LOCKED, and a worker renews its lease while it works rather than guessing a duration up front. - Qdrant holds embeddings, one collection per installation with workspace isolation enforced in the filter.
- sandbox runs anything untrusted — a test suite, a build — as its own uid on its own network, with no database, no keys and a read-only root.
- LiteLLM is optional. Set
LITELLM_PROXY_URLandLITELLM_MASTER_KEYtogether and every call routes through the gateway; leave either empty and provider keys are used directly.
#Troubleshooting
A container will not start. docker compose logs <service>. The API says
at startup which optional features are unavailable and why, rather than failing
quietly.
Reviews produce nothing. Check GET /healthz for the resolved clocks, then
docker compose logs api | grep agent_. Each agent logs its elapsed time, its
model and its failure code.
A timeout, not an outage. local_timeout means this installation's own
deadline elapsed before the provider answered — raise
REVIEW_LLM_TIMEOUT_SECONDS. It is deliberately not reported as a provider
fault.
Q&A cites nothing. The repository is probably not indexed, or is indexed
without embeddings. Repositories shows the state of each; analyzer graph-stats <repo> shows what parsed.
The sandbox is always busy. SANDBOX_SLOTS is how many jobs run at once
and is the knob that costs memory. SANDBOX_SLOT_WAIT is how long a caller
queues before being told to come back.
#Project layout
src/
  api/          FastAPI app, routers, schemas
  review/       PR review — agents, orchestrator, providers, policies
  indexing/     parsers, symbol graph, embeddings
  qa/           retrieval and answer composition
  generation/   documentation vault
  llm/          provider clients, error taxonomy, cost ledger
  sync/         git providers, the durable job queue, workers
  sandbox/      the isolated execution server
  mcp_server/   the MCP surface
  security/     redaction, patterns, log filtering
web/            Next.js UI (App Router, 16 locales)
tests/          5200+ tests
deploy/         Caddy overlay and the LiteLLM gateway config
docs/           deploy guides and the end-to-end walk-through
bench/          benchmark harness and results
#Provenance and rights
This repository has a single root commit over about a hundred thousand lines — the shape a code drop of unclear origin has to a provenance scanner, and one that needs an explanation rather than a shrug. It has one: PROVENANCE.md states the licence position and the origin of the code — development happened privately before this commit, and none of it is needed to build, audit or fork what is here.
That file is a record of facts, not the licence. The licence is
AGPL-3.0, with one exception: anything under ee/, and any file
whose name contains .ee., is covered by LICENSE_EE instead.
LICENSING.md states the boundary in full — LICENSE itself is
the unmodified AGPL text, because a licence file with a preamble in front of
it is not recognised as that licence.
Two enterprise features live behind it today — single sign-on (OIDC /
Keycloak) and review analytics, in src/ee/ and web/ee/, switched on by an
offline licence key (see ee/README.md). The boundary was drawn
before the first tag because adding it afterwards means re-asking every
contributor who has already sent work under an unqualified AGPL.
Everything else shipped here is AGPL, including the parts that look commercial: the audit console, usage and spend, compliance checks, installation metrics. Security controls are never enterprise-only — the audit log is written under AGPL and always will be. See CONTRIBUTING.md for where new code goes.